Explore our network of country and industry based websites to access localized information, product offerings, and business services across our group.

Access reliable chemical market information through our update channels.
Real-time Updates
Daily Updates
Log in to start sending quotation requests for any product.
Don't have an account? Sign Up Here
Home Mapping the Flow: A Regional Deep-Dive into Crude Glycerine Supply & Demand Hotspots Towards 2040
Market Insight | 13 October 2025
Success in the global crude glycerine market hinges on understanding its geography. A profound imbalance between where glycerine is produced and where it is consumed creates complex trade flows and significant opportunities for businesses with the expertise to manage global logistics. At its core, this is a market defined by strategic movement and regional dominance.
Understanding these intricate global trade routes is the key to unlocking profitability. At Tradeasia International, our expertise in palm-based oleochemicals gives us a strategic vantage point, particularly in navigating the critical APAC-to-global supply corridor and ensuring our partners can capitalize on these regional dynamics.
The Epicenters of Global Supply
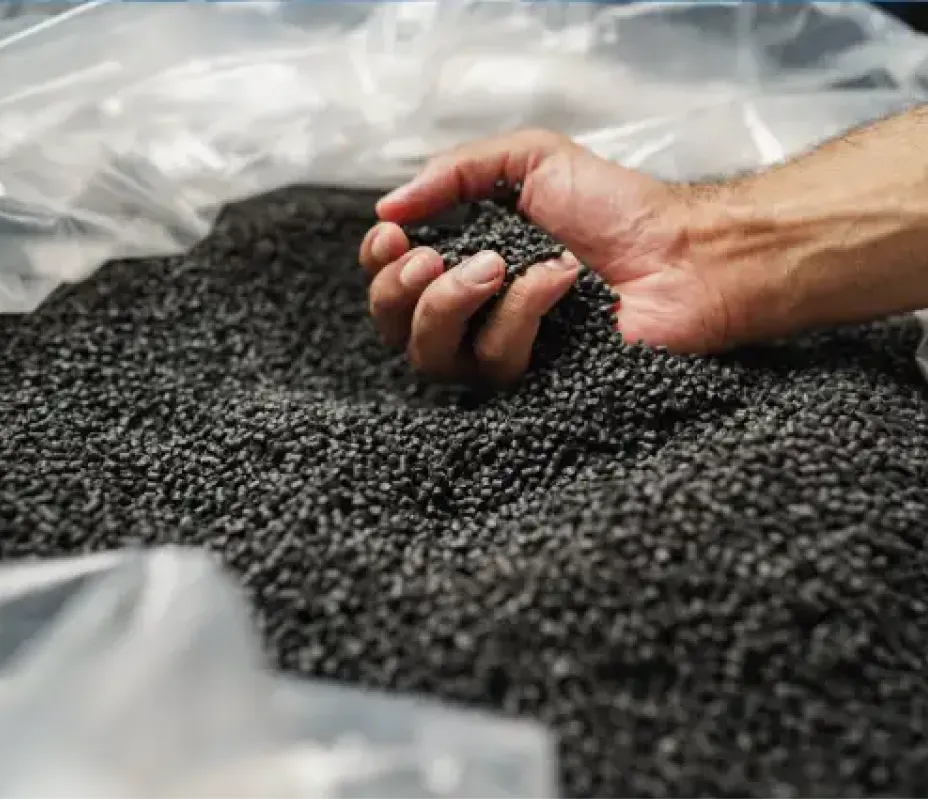
The engine room of global glycerine production is undoubtedly the Asia-Pacific (APAC) region, which commands over 50% of the world's supply. This dominance is driven by the colossal palm oil industry, with Indonesia leading at 1.5 million metric tons (MT) annually, followed by Malaysia with 600,000 MT. The dominance of this region cannot be overstated. As a sourcing manager at a leading chemical firm recently stated, "Our entire strategy hinges on reliable offtake from Southeast Asia; it's the heartbeat of the market." The Americas form the second production hub, with the United States contributing 1 million MT from soybean oil and South America adding another 800,000 MT. Europe, with its rapeseed-based production, holds a steady but smaller share at around 950,000 MT.
Where Supply Meets Insatiable Demand
On the consumption side, all roads lead to China. The manufacturing giant is the world's primary importer, absorbing over 800,000 MT of crude glycerine each year. A remarkable 60% of this volume is funneled directly into its epichlorohydrin (ECH) industry. The European Union follows as a major consumer, importing around 500,000 MT annually, primarily for refining into high-purity grades for its pharmaceutical and cosmetic sectors. Looking ahead to 2040, APAC’s production share is forecast to climb towards 60%. This supply will meet surging demand from new industrializing markets in India and Africa, where import volumes are projected to grow by a staggering 150% from 2025 levels.
Sources:
International Energy Agency (IEA): Renewables 2023 - Analysis and Forecast to 2028.
Palm Chemicals: The Versatility of Palm Oil Derivatives.
UN Comtrade: International Trade Statistics Database.
We're committed to your privacy. Tradeasia uses the information you provide to us to contact you about our relevant content, products, and services. For more information, check out our privacy policy.

 English
 Indonesian
 简体字
简体字
 العربية
 Español
 Français
 Português
 日本語
日本語
 한국어
한국어
 Tiếng Việt